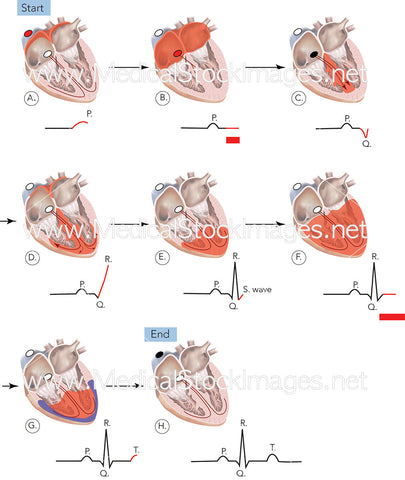
Electrocardiogram (ECG)
Image Description:
Illustration showing electrical events in the cardiac cycle and electrocardiogram (ECG). An ECG is used to measure the electrical activity of the heart caused by depolarisation and repolarisation of the atria and ventricles.
Image File Sizes:
|
Size |
Pixels |
Inches |
cm |
|
Small |
506x600px |
1.7x2.0” @300dpi |
4.3x5.1cm @300dpi |
|
Medium |
1558x1848px |
5.2x6.2” @300dpi |
13.2x15.7cm @300dpi |
Anatomy Visible in the Medical Illustration Includes:
Heart, cardiac cycle, electrocardiogram, ECG, sinoatrial node, superior vena cava, left atrium, left ventricle, left bundle branch, interventricular septum, septomarginal trabecula, right bundle branch, right ventricle, atrioventricular bundle, atrioventricular node, right atrium
Image created by:
We Also Recommend


